2QFY2019 Result Update | Dairy Products
November 6, 2018
Parag Milk Foods
BUY
CMP
`256
Performance Update
Target Price
`330
Y/E March (` cr)
Q2FY19
Q2FY18
% yoy
Q1FY19
% qoq
Investment Period
12 Months
Net sales
573
505
13.7%
549
4.4%
EBITDA
58
50
16.3%
60
-2.7%
EBITDA margin (%)
Stock Info
10.1%
9.9%
10.9%
Adjusted PAT
30
25
22.2%
28
7.6%
Sector
Dairy Products
Market Cap (` cr)
2,153
For Q2FY2019, Parag Milk Foods (PARAG) posted decent performance with
Net Debt (` cr)
214
14%/22% yoy growth in revenue/ PAT led by 23 bps expansion in margin. The
Beta
1.1
company has maintained its revenue target of `2700+ crore for FY2020 backed
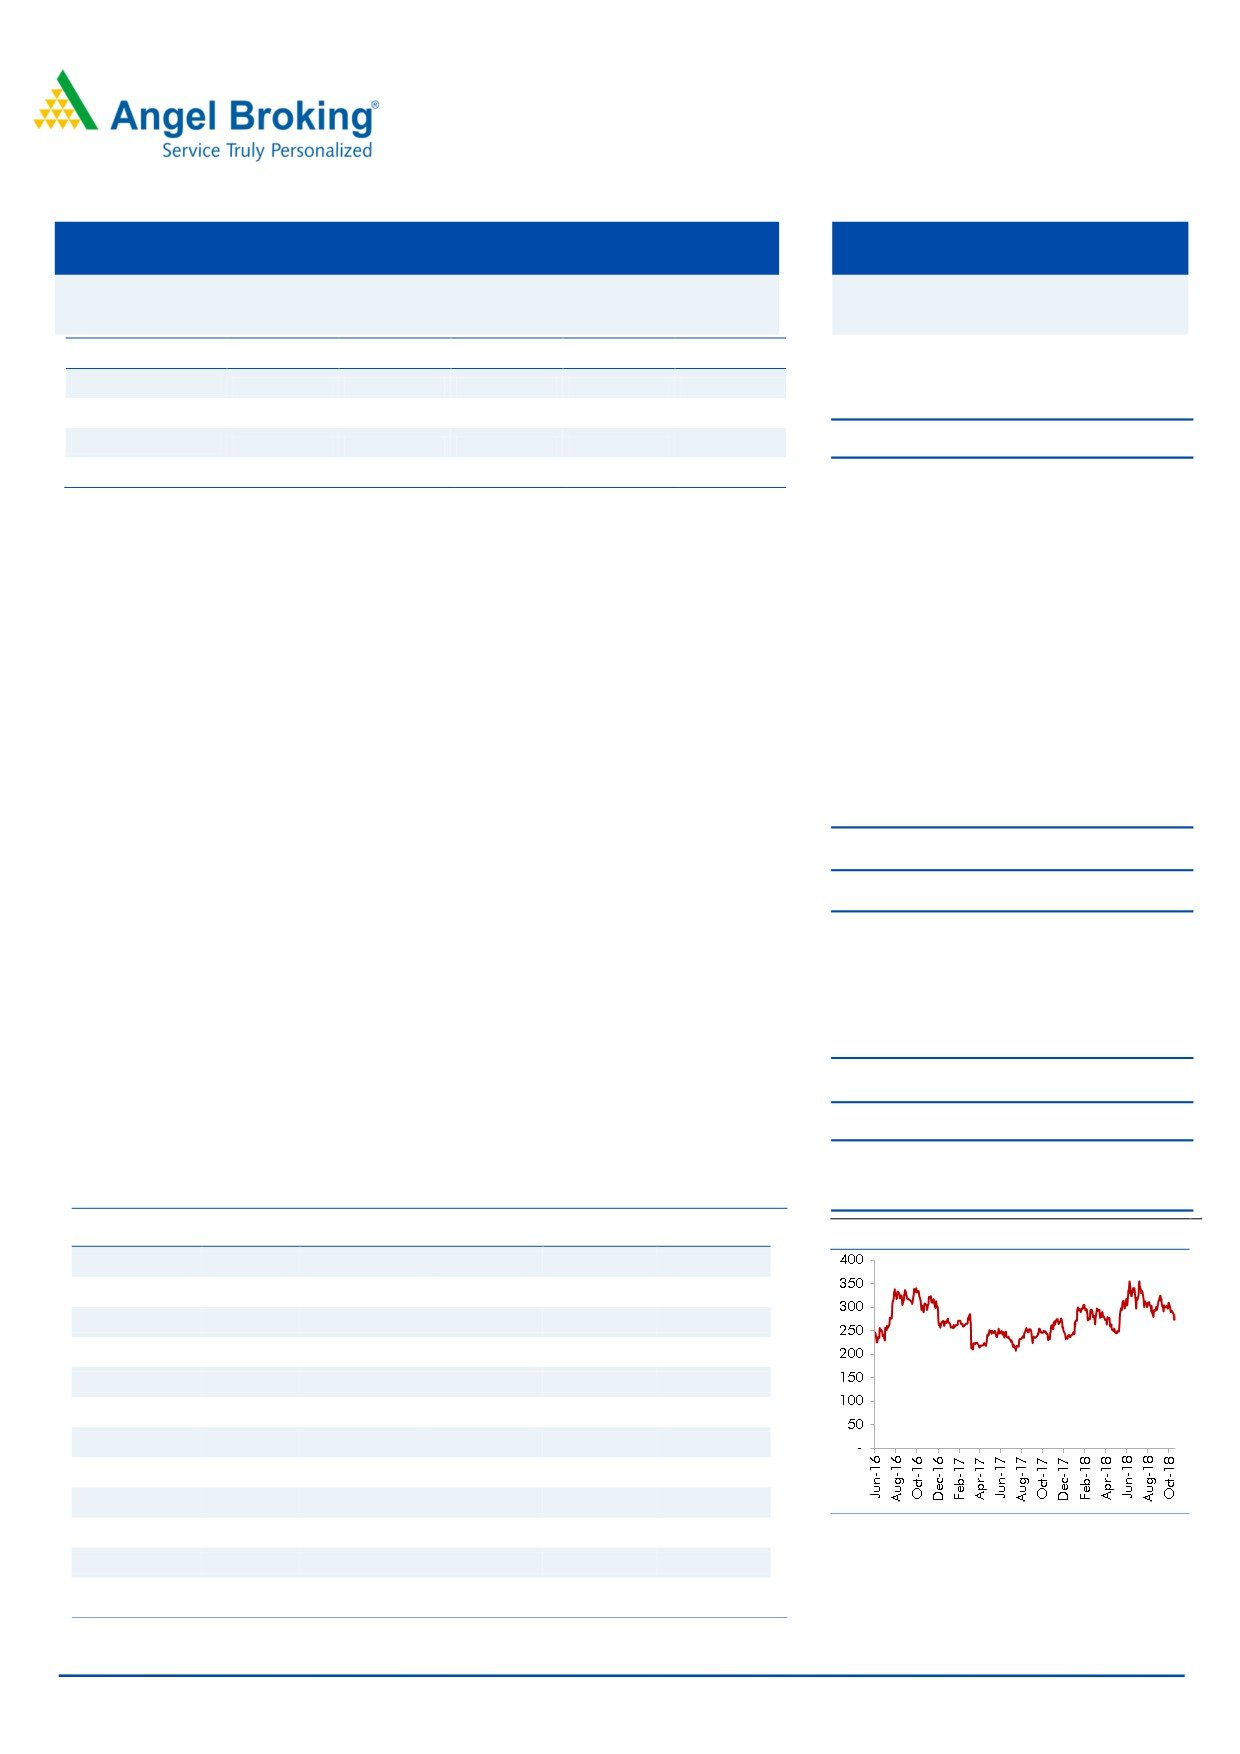
52 Week High / Low
414/220
by widening distribution network and product portfolio.
Avg. Daily Volume
1,38,424
Revenue rose 14%: Q2’s top-line growth was led by growth in the high-margin
Face Value (`)
10
Value Added Products (VAP) segment. It is introducing many new products/
BSE Sensex
34,950
Nifty
10,524
variants of existing products like premium ghee, protein powder, Mishti Doi which
Reuters Code
PAMF.NS
would boost its revenue in coming quarters.
Bloomberg Code
PARAG.IN
Margins were decent: On the operating front, the company’s margin were robust
at 10.1% due to lower input cost which offset rise in employee and other
expenses. The company has guided for 11-12% by FY2020 on the back of
Shareholding Pattern (%)
improving product mix and distribution network.
Promoters
45.9
Outlook and Valuation: We have maintained our earnings estimates in view of
MF / Banks / Indian Fls
11.9
new products pipeline and robust H1 performance. We expect PARAG to report a
FII / NRIs / OCBs
21.2
CAGR of ~17%/35% in revenue/ earnings over FY18-20E. The stock is currently
Indian Public / Others
20.8
trading at 13.4x its FY2020 earnings, which looks attractive looking at its evolving
FMCG story. We maintain BUY with a revised target price of `330 (17x FY2020E
Abs. (%)
3m 1yr
3yr
EPS).
Sensex
(5.8)
3.9
33.3
Key Financials
PARAG
(17.9)
(7.2)
-
Y/E March (` cr)
FY2016
FY2017
FY2018E
FY2019E
FY2020E
Price Chart
Net Sales
1,645
1,731
1,986
2,271
2,706
% chg
13.9
5.2
14.8
14.3
19.2
Net Profit
49.4
35.9
89.2
115.4
162.1
% chg
33.0
(27.2)
148.1
29.4
40.5
OPM (%)
9.0
5.1
10.0
10.4
11.1
EPS (Rs)
5.9
4.3
10.6
13.7
19.3
P/E (x)
44.0
60.4
24.3
18.8
13.4
P/BV (x)
5.8
3.2
2.8
2.4
2.1
RoE (%)
13.6
5.5
12.0
13.4
15.9
RoCE (%)
15.3
4.3
15.3
17.2
20.8
Source: Company, Angel Research
EV/Sales (x)
1.6
1.3
1.1
1.0
0.8
Nidhi Agrawal
EV/EBITDA (x)
17.2
26.3
11.5
9.8
7.6
022 - 3935 7800 Ext: 6872
Source: Company, Angel Research
Please refer to important disclosures at the end of this report
1
Parag Milk Foods |2QFY2019 Result Update
Research Team Tel: 022 - 39357800
DISCLAIMER:
Angel Broking Limited (hereinafter referred to as “Angel”) is a registered Member of National Stock Exchange of India Limited, Bombay
Stock Exchange Limited, Metropolitan Stock Exchange Limited, Multi Commodity Exchange of India Ltd and National Commodity &
Derivatives Exchange Ltd It is also registered as a Depository Participant with CDSL and Portfolio Manager and Investment Adviser with
SEBI. It also has registration with AMFI as a Mutual Fund Distributor. Angel Broking Limited is a registered entity with SEBI for Research
Analyst in terms of SEBI (Research Analyst) Regulations, 2014 vide registration number INH000000164. Angel or its associates has not
been debarred/ suspended by SEBI or any other regulatory authority for accessing /dealing in securities Market. Angel or its
associates/analyst has not received any compensation / managed or co-managed public offering of securities of the company covered
by Analyst during the past twelve months.
This document is solely for the personal information of the recipient, and must not be singularly used as the basis of any investment
decision. Nothing in this document should be construed as investment or financial advice. Each recipient of this document should make
such investigations as they deem necessary to arrive at an independent evaluation of an investment in the securities of the companies
referred to in this document (including the merits and risks involved), and should consult their own advisors to determine the merits and
risks of such an investment.
Reports based on technical and derivative analysis center on studying charts of a stock's price movement, outstanding positions and
trading volume, as opposed to focusing on a company's fundamentals and, as such, may not match with a report on a company's
fundamentals. Investors are advised to refer the Fundamental and Technical Research Reports available on our website to evaluate the
contrary view, if any
The information in this document has been printed on the basis of publicly available information, internal data and other reliable
sources believed to be true, but we do not represent that it is accurate or complete and it should not be relied on as such, as this
document is for general guidance only. Angel Broking Limited or any of its affiliates/ group companies shall not be in any way
responsible for any loss or damage that may arise to any person from any inadvertent error in the information contained in this report.
Angel Broking Limited has not independently verified all the information contained within this document. Accordingly, we cannot testify,
nor make any representation or warranty, express or implied, to the accuracy, contents or data contained within this document. While
Angel Broking Limited endeavors to update on a reasonable basis the information discussed in this material, there may be regulatory,
compliance, or other reasons that prevent us from doing so.
This document is being supplied to you solely for your information, and its contents, information or data may not be reproduced,
redistributed or passed on, directly or indirectly.
Neither Angel Broking Limited, nor its directors, employees or affiliates shall be liable for any loss or damage that may arise from or in
connection with the use of this information.
Disclosure of Interest Statement
Parag Milk Foods
1. Financial interest of research analyst or Angel or his Associate or his relative
No
2. Ownership of 1% or more of the stock by research analyst or Angel or associates or
No
relatives
3. Served as an officer, director or employee of the company covered under Research
No
4. Broking relationship with company covered under Research
No
Ratings (Based on Expected Returns:
Buy (> 15%)
Accumulate (5% to 15%)
Neutral (-5 to 5%)
over 12 months investment period)
Reduce (-5% to -15%)
Sell (< -15%)
November 6, 2018
8